The big beautiful bill: Stimulus now, tightening later
Chief Economist Eugenio J. Alemán discusses current economic conditions.
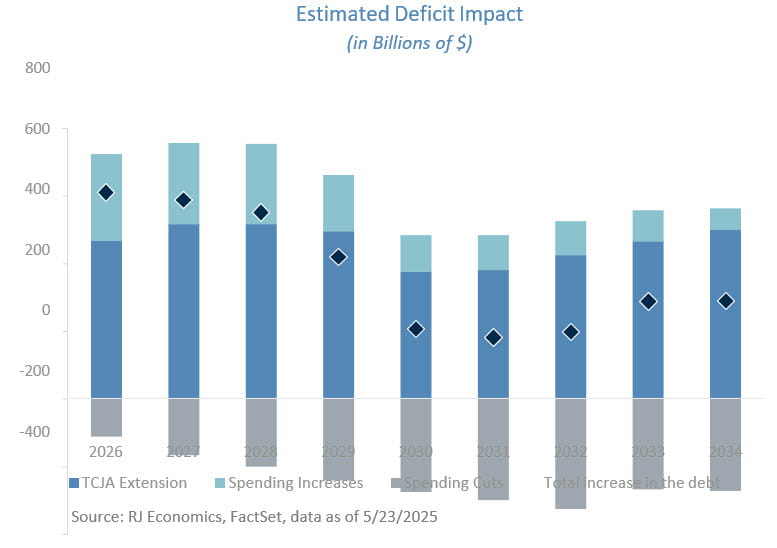
While official estimates remain fluid and subject to change, our preliminary analysis at the time of this writing suggests that the House Reconciliation Proposal could significantly increase the national debt over the next decade. In addition to the continuation and expansion of provisions from the Tax Cuts and Jobs Act (TCJA), the Ways and Means Committee’s tax proposals are expected to contribute notably to the debt, primarily due to expanded individual and estate tax measures and the introduction of new tax policies. These increases are partially offset by substantial savings from revisions to energy and clean vehicle tax credits enacted under the Inflation Reduction Act. Despite notable spending reductions across programs such as Medicaid, student loans, and the Supplemental Nutrition Assistance Program, lower tax revenues and rising costs in other areas are likely to keep the fiscal deficit elevated and continue adding to the national debt.
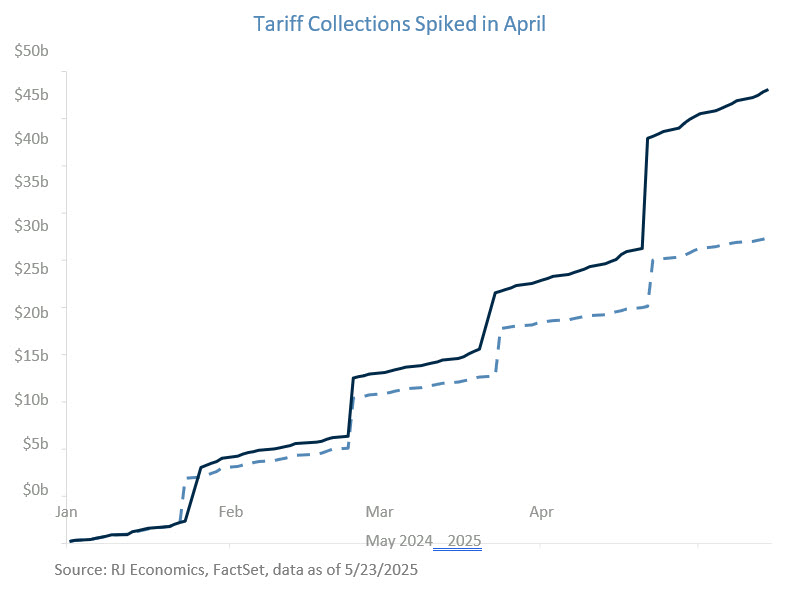
Based on last year’s import data, the more than $3 trillion that the U.S. imports every year could theoretically yield significant tariff revenues. However, actual collections are likely to be less due to behavioral responses and price elasticity, as consumers adjust their spending or switch to alternatives. While it's hard to pinpoint the exact impact, our annual outlook anticipates a substantial amount in tariff revenue. This projection aligns with a broad range of recent economic and academic estimates. As such, the expected revenue could help offset some of the costs of the newly proposed provisions and contribute to covering rising interest payments tied to national debt growth.
However, this projection has several flaws as it assumes no decline in import volumes, which is an optimistic scenario given the potential for trade tensions and demand shifts. Additionally, retaliatory tariffs from other countries could further reduce net revenues, as some of the gains would need to be redirected to support sectors impacted by those reciprocal measures. For example, in 2018 and 2019, a significant portion of the tariff revenues collected in 2018 was redistributed to the agricultural sector that was targeted by retaliatory tariffs imposed by countries like China, the European Union, and others. Therefore, if we have a net increase in tariff revenues, it will be used to either transfer income to sectors negatively affected by reciprocal tariffs and/or to, potentially, lower the deficit compared to the baseline.
Economic impact:
Proposed cuts to Medicaid and potentially Medicare could result in reduced or lost coverage for the nearly 80 million Americans who depend on these programs. Similarly, proposed reductions to the Supplemental Nutrition Assistance Program (SNAP) could affect over 40 million individuals who rely on monthly food assistance. These changes would likely impose financial strains on states, which would receive less federal funding and bear more of the cost, and on families, who would face higher out-of-pocket expenses. In addition, proposed changes to student aid, such as restrictions on subsidized and income-driven repayment plans, limits on borrowing, and tighter Pell Grant eligibility, could hinder students’ ability to afford or access higher education. While these cuts may be fiscally appealing from a fiscal deficit-reduction standpoint, they risk disproportionately impacting low-income households, retirees, and students, groups that are already financially vulnerable according to the most recent Credit and Debt Household report. Additionally, while most of these net spending cuts are back-loaded, reductions in government expenditures and investment will also weigh on GDP growth.
On the other hand, expanding the Tax Cuts and Jobs Act (TCJA) could provide benefits across income groups. Low- and middle-income individuals would continue to benefit from extended provisions such as the doubled standard deduction and expanded child tax credits. Meanwhile, higher-income households and corporations would benefit from lower income tax rates, increased deductions, expanded estate and gift tax exemptions, and reduced corporate tax rates.
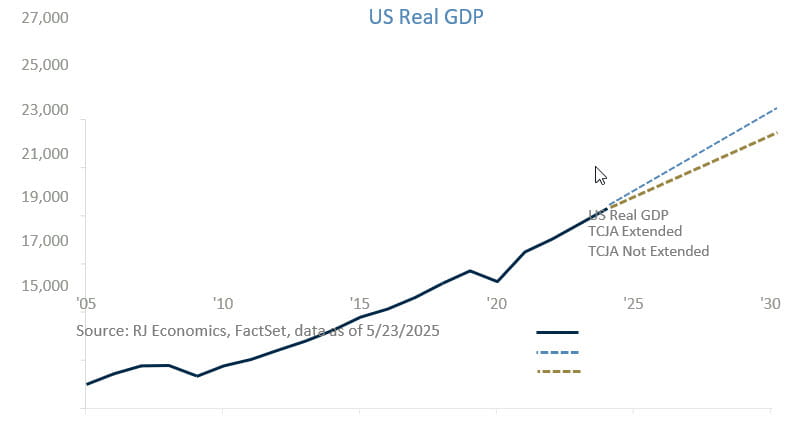
While the combined effects of expanding the TCJA and implementing proposals from various congressional committees may largely offset each other, one outcome is clear: allowing the current TCJA tax cuts to expire would have a significant economic impact. The resulting financial strain on consumers, compounded by potential price increases from tariffs, could dampen spending and economic activity. Additionally, higher corporate taxes could lead businesses to delay or scale back investments. Together, these factors would increase the risk of a recession. Fortunately, we anticipate that the 2017 Tax Cuts and Jobs Act (TCJA) will be extended and that several key elements of the reconciliation proposal will be enacted. Together, these measures are expected to bolster economic growth, even in the face of rising debt levels.
Since the COVID-19 pandemic, the US economy has been growing around 2.5%, above its potential output of 1.8-2.0%. While strong growth is generally positive, this sustained pace has kept demand consistently above the economy’s capacity, putting upward pressure on prices (both prices of resources as well as consumer prices) and therefore increasing inflation. As a result, resource utilization remains high, which tends to keep price pressures elevated. This has the potential to keep interest rates higher than in the pre- pandemic period. Higher economic growth through debt-financed fiscal expansion will keep both the trade and fiscal deficits elevated. Our projections suggest that, without intervention, federal debt held by the public as a share of GDP could rise to levels not seen since World War II before the end of the decade. With the additional costs tied to the proposed House bill, the federal debt held by the public could rise to approximately 125% of GDP within the next decade, reinforcing the rationale behind Moody’s recent credit downgrade, which cited concerns over the US fiscal trajectory and long-term debt sustainability.
Economic and market conditions are subject to change.
Opinions are those of Investment Strategy and not necessarily those of Raymond James and are subject to change without notice. The information has been obtained from sources considered to be reliable, but we do not guarantee that the foregoing material is accurate or complete. There is no assurance any of the trends mentioned will continue or forecasts will occur. Past performance may not be indicative of future results.
Consumer Price Index is a measure of inflation compiled by the US Bureau of Labor Statistics. Currencies investing is generally considered speculative because of the significant potential for investment loss. Their markets are likely to be volatile and there may be sharp price fluctuations even during periods when prices overall are rising.
Consumer Sentiment is a consumer confidence index published monthly by the University of Michigan. The index is normalized to have a value of 100 in the first quarter of 1966. Each month at least 500 telephone interviews are conducted of a contiguous United States sample.
Personal Consumption Expenditures Price Index (PCE): The PCE is a measure of the prices that people living in the United States, or those buying on their behalf, pay for goods and services. The change in the PCE price index is known for capturing inflation (or deflation) across a wide range of consumer expenses and reflecting changes in consumer behavior.
The Consumer Confidence Index (CCI) is a survey, administered by The Conference Board, that measures how optimistic or pessimistic consumers are regarding their expected financial situation. A value above 100 signals a boost in the consumers’ confidence towards the future economic situation, as a consequence of which they are less prone to save, and more inclined to consume. The opposite applies to values under 100.
Certified Financial Planner Board of Standards Center for Financial Planning, Inc. owns and licenses the certification marks CFP®, CERTIFIED FINANCIAL PLANNER®, and CFP® (with plaque design) in the United States to Certified Financial Planner Board of Standards, Inc., which authorizes individuals who successfully complete the organization’s initial and ongoing certification requirements to use the certification marks.
Links are being provided for information purposes only. Raymond James is not affiliated with and does not endorse, authorize or sponsor any of the listed websites or their respective sponsors. Raymond James is not responsible for the content of any website or the collection or use of information regarding any website's users and/or members.
GDP Price Index: A measure of inflation in the prices of goods and services produced in the United States. The gross domestic product price index includes the prices of U.S. goods and services exported to other countries. The prices that Americans pay for imports aren't part of this index.
Employment cost Index: The Employment Cost Index (ECI) measures the change in the hourly labor cost to employers over time. The ECI uses a fixed “basket” of labor to produce a pure cost change, free from the effects of workers moving between occupations and industries and includes both the cost of wages and salaries and the cost of benefits.
US Dollar Index: The US Dollar Index is an index of the value of the United States dollar relative to a basket of foreign currencies, often referred to as a basket of U.S. trade partners' currencies. The Index goes up when the
U.S. dollar gains "strength" when compared to other currencies.
Import Price Index: The import price index measure price changes in goods or services purchased from abroad by U.S. residents (imports) and sold to foreign buyers (exports). The indexes are updated once a month by the Bureau of Labor Statistics (BLS) International Price Program (IPP).
ISM Services PMI Index: The Institute of Supply Management (ISM) Non-Manufacturing Purchasing Managers' Index (PMI) (also known as the ISM Services PMI) report on Business, a composite index is calculated as an indicator of the overall economic condition for the non-manufacturing sector.
Consumer Price Index (CPI) A consumer price index is a price index, the price of a weighted average market basket of consumer goods and services purchased by households.
Producer Price Index: A producer price index(PPI) is a price index that measures the average changes in prices received by domestic producers for their output.
Industrial production: Industrial production is a measure of output of the industrial sector of the economy. The industrial sector includes manufacturing, mining, and utilities. Although these sectors contribute only a small portion of gross domestic product, they are highly sensitive to interest rates and consumer demand.
The NAHB/Wells Fargo Housing Opportunity Index (HOI) for a given area is defined as the share of homes sold in that area that would have been affordable to a family earning the local median income, based on standard mortgage underwriting criteria.
Conference Board Coincident Economic Index: The Composite Index of Coincident Indicators is an index published by the Conference Board that provides a broad-based measurement of current economic conditions, helping economists, investors, and public policymakers to determine which phase of the business cycle the economy is currently experiencing.
Conference Board Lagging Economic Index: The Composite Index of Lagging Indicators is an index published monthly by the Conference Board, used to confirm and assess the direction of the economy's movements over recent months.
New Export Index: The PMI New export orders index allows us to track international demand for a country's goods and services on a timely, monthly, basis.
Gold is subject to the special risks associated with investing in precious metals, including but not limited to: price may be subject to wide fluctuation; the market is relatively limited; the sources are concentrated in countries that have the potential for instability; and the market is unregulated.
The Conference Board Leading Economic Index: Intended to forecast future economic activity, it is calculated from the values of ten key variables.
Source: FactSet, data as of 12/6/2024


